RatRaceScoreTrack your way to financial independence
ChartsWhy Track?SnowballSign inCreate account

Data & benchmarks

Income & Net Worth Charts

Where do you stand relative to US and global households? These six charts break down household income and net worth by age, decile, and percentile — sourced from the Census Bureau, Federal Reserve, World Inequality Lab, and UBS Global Wealth Report — so you can see the benchmarks behind your own RatRace Score.
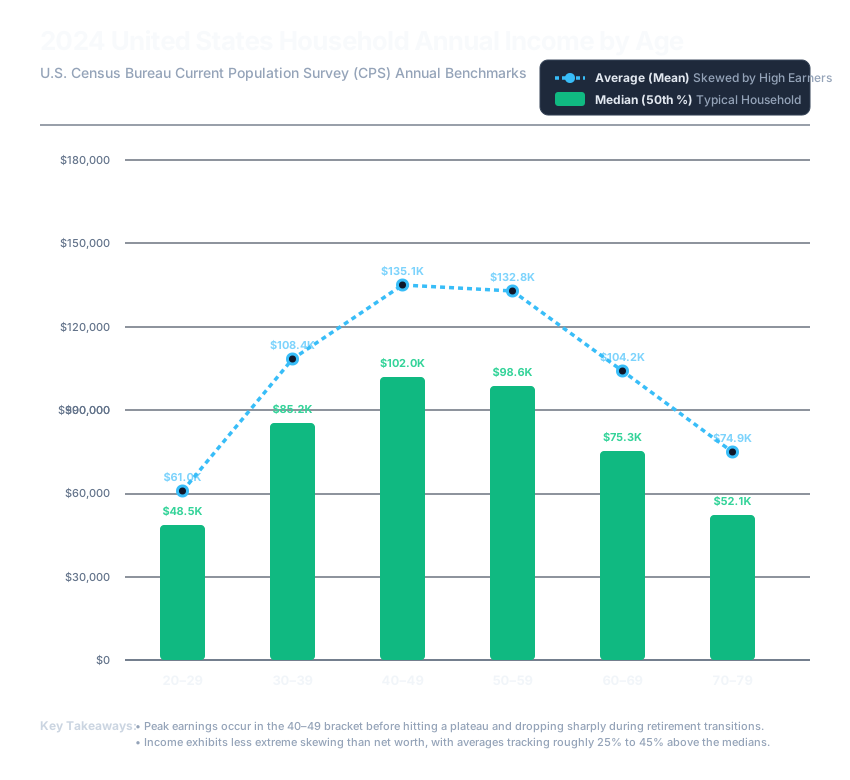
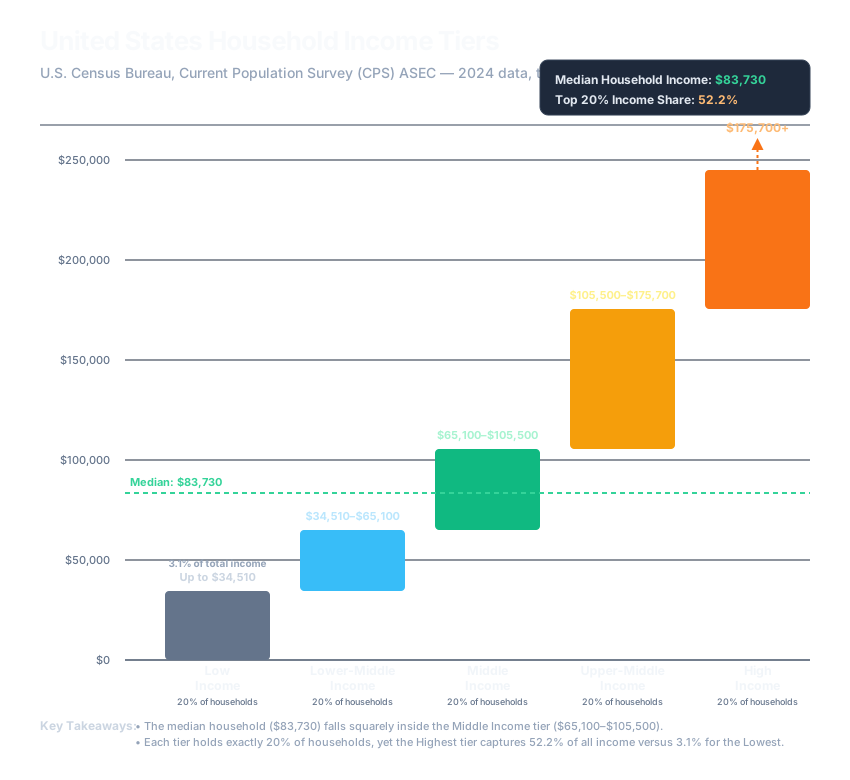
US Household Income by Age (2024)

Income benchmarks

US Household Income by Age

How US household income, both median and average, rises and falls across the 20s through the 70s, based on Census Bureau CPS benchmarks for every age bracket.

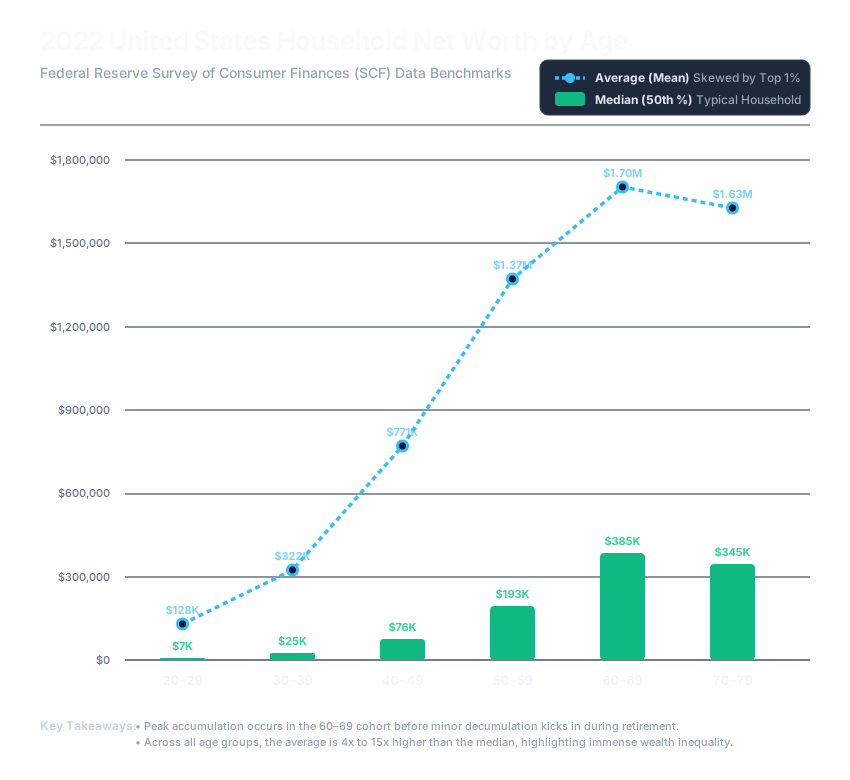
US Household Net Worth by Age (2022)

Net worth benchmarks

US Net Worth by Age

Median and average US household net worth by age bracket, from the Federal Reserve Survey of Consumer Finances — and why the gap between the two numbers keeps widening.

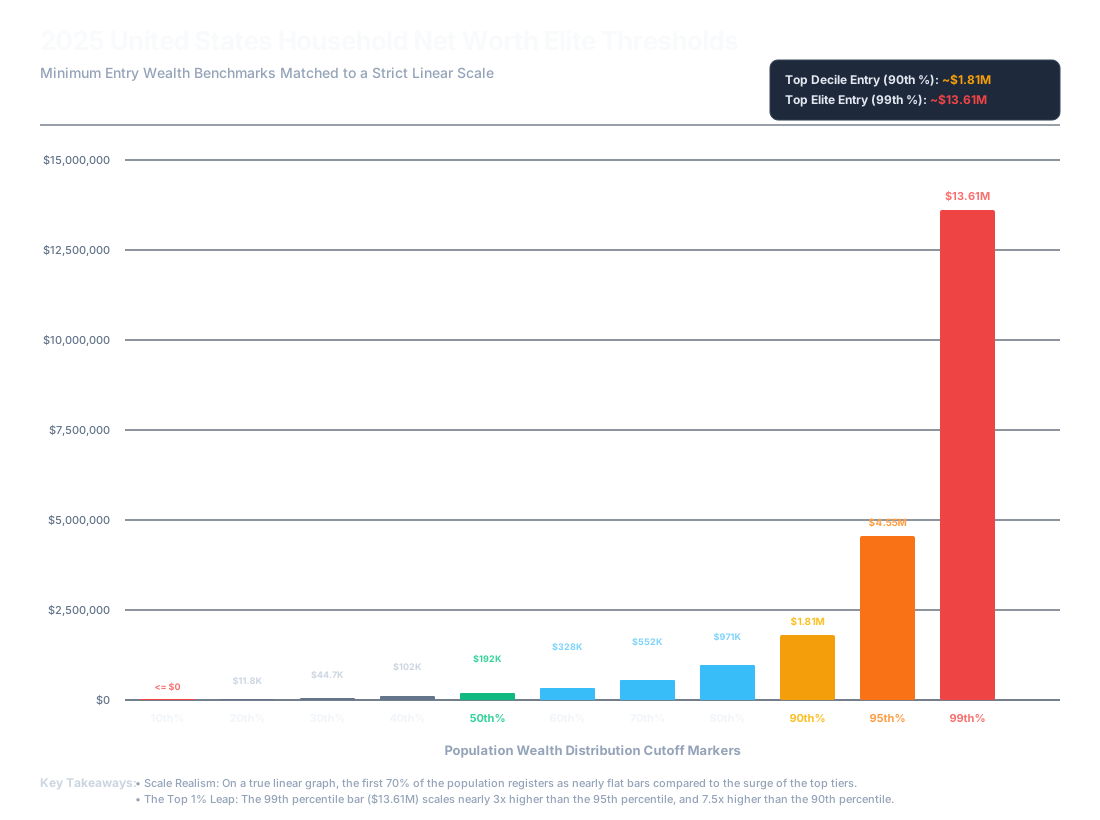
US Household Net Worth Elite Thresholds (2025)

Wealth thresholds

US Net Worth by Decile

The minimum net worth to enter the top decile (~$1.81M) and the top 1% (~$13.61M) of US households, plotted on a strict linear scale for easy comparison.

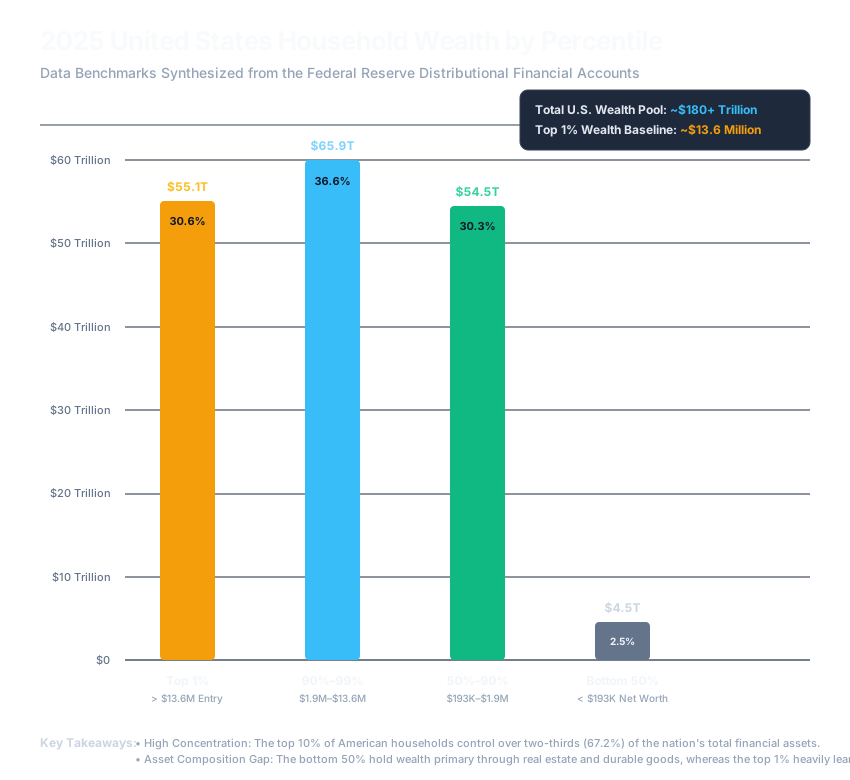
US Household Wealth by Percentile (2025)

Wealth concentration

US Net Worth by Percentile

How the $180+ trillion held by US households splits across the bottom 50%, the middle class, and the top 10% and top 1%, based on Federal Reserve Distributional Financial Accounts data.

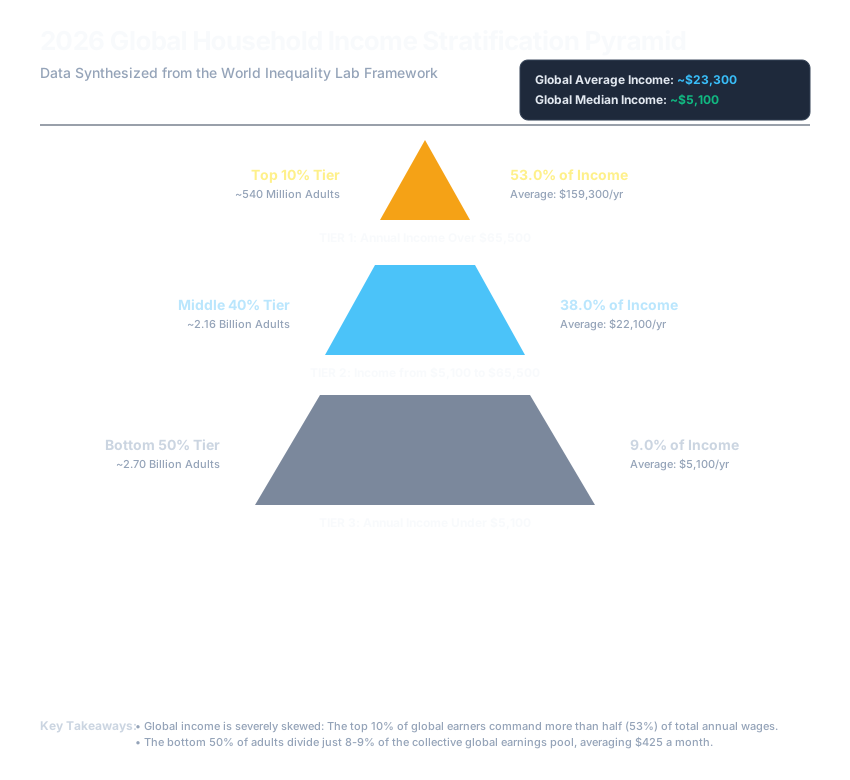
Global Household Income Stratification (2026)

Global income

World Household Income

Where the world’s roughly 5.4 billion adults sit on the global income pyramid, from the World Inequality Lab framework — and what it takes to be in the global top 10%.

Global Wealth Stratification Pyramid (2024)

Global wealth

World Household Net Worth

How $470 trillion in global household wealth is split across four tiers, from under $10,000 to over $1,000,000 net worth, per the UBS Global Wealth Report framework.

None of these benchmarks tell you what you personally should do — but they do tell you where you stand. If your income or net worth trails the median for your age bracket, that's useful information, not a verdict: it points at whether the fix is spending less, earning more, or converting savings into assets that pay you passively. If you're already ahead, these charts are a reminder that the goal isn't just a bigger number — it's a RatRace Score that covers your expenses, whatever the benchmark says.

Home · All Charts · Why Track? · Terms · Privacy