
Income benchmarks
US Household Income Tiers
Source: U.S. Census Bureau, Current Population Survey (CPS) Annual Social and Economic Supplement — 2024 data, the latest available
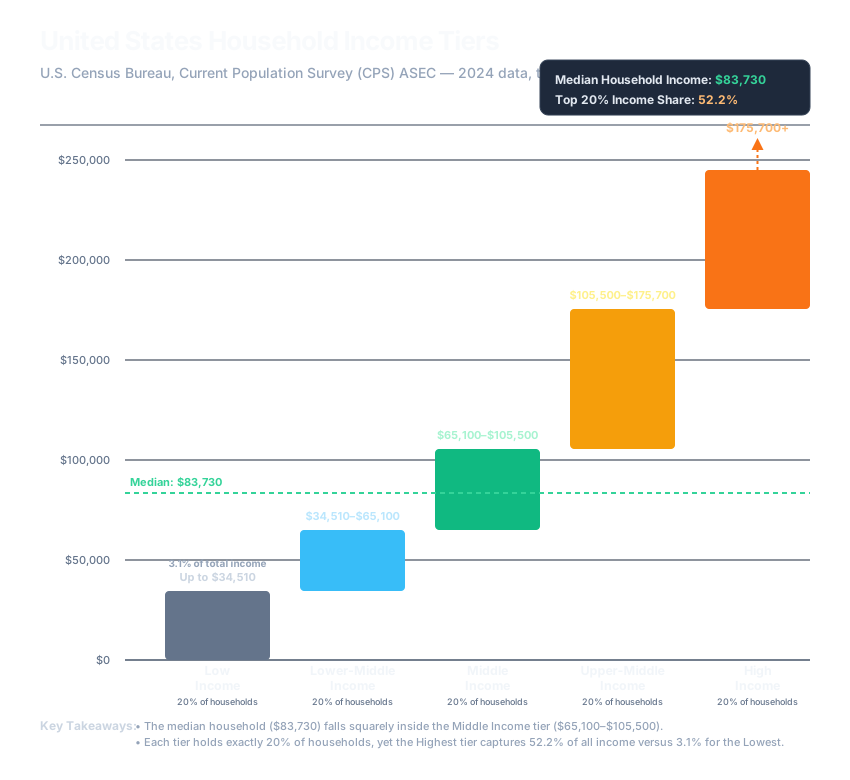
The Census Bureau splits every US household into five equal-sized tiers — quintiles — ranked by income, from Low Income (up to $34,510) to High Income ($175,700 and up). Each tier holds exactly 20% of households, but the dollar range each tier covers — and the share of total income it holds — is anything but even.
Five equal groups, five very different widths
The Low Income tier spans a $34,510 band; the Upper-Middle Income tier above it spans more than four times that — $70,200. The Highest tier has no upper bound at all. Same population share, wildly different dollar ranges: that asymmetry is the whole story of income inequality compressed into one chart.
The median sits inside the middle, not at its edge
Median household income ($83,730) doesn't land on a tier boundary — it falls inside the Middle Income tier ($65,100–$105,500), well above that tier's floor. Half of all US households earn more than that, half less, and a typical household still has room to move up within its own tier before crossing into the next one.
The Highest tier holds more than half of all income
The Highest Income tier captures 52.2% of aggregate household income despite being exactly one-fifth of households — while the Lowest tier, an equally-sized fifth, holds just 3.1%. Those two numbers, from the same equally-populated tiers, are the clearest single measure of how concentrated income actually is.
Why this matters for your RatRace Score
Your income tier says nothing about your RatRace Score. A High Income household with expenses that scale with its earnings can still be stuck at Survival, while a Low Income household with modest, well-covered expenses and a bit of passive income can already be at Security or Freedom. The tier chart above is about where your paycheck sits nationally — your score is about whether that paycheck's passive slice already covers your life without one.
See how your income and expenses translate into your own RatRace Score.
Create a free account →Home · Learn · All Charts · Why Track? · Terms · Privacy