
Net worth benchmarks
US Household Net Worth by Age
Source: Federal Reserve Survey of Consumer Finances (SCF) Data Benchmarks — 2022 data
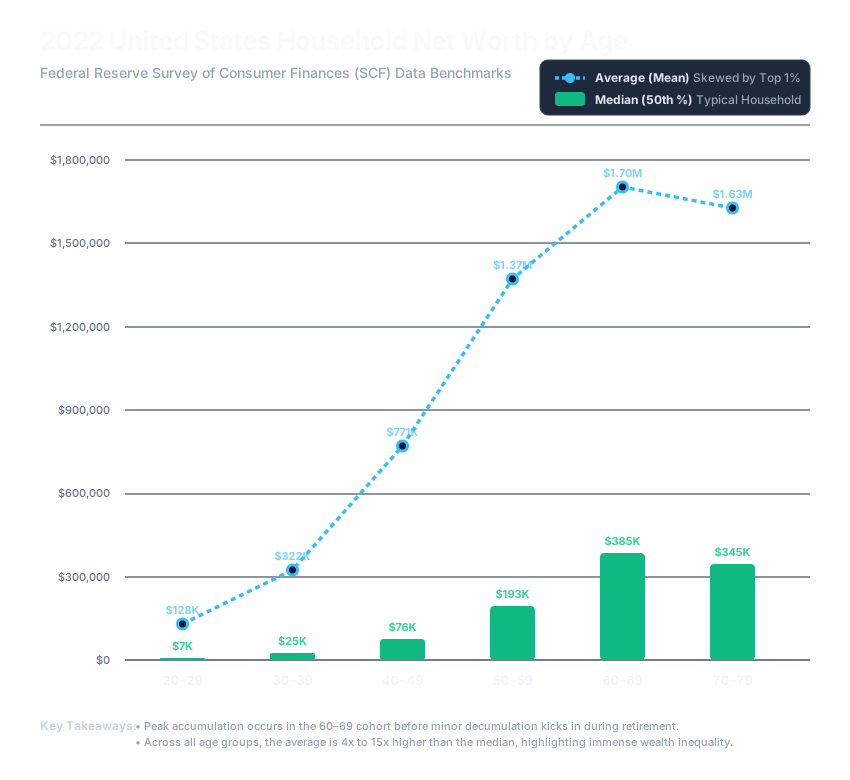
Net worth compounds far more dramatically than income does across a lifetime. Federal Reserve SCF data shows median household net worth growing from just $7,000 in the 20s to a peak of $385,000 in the 60–69 bracket — a 55x increase — before easing slightly to $345,000 in the 70s as retirees begin drawing down assets.
The average-to-median gap widens with age
In the 20s, the average household ($128K) already sits 18x above the median ($7K) — a small dollar gap that looks enormous in relative terms. By the 60s, the average ($1.70M) is only about 4.4x the median ($385K) in relative terms, but the absolute gap has ballooned to well over $1.3 million. The SVG's own key takeaway puts it plainly: the average runs 4x to 15x higher than the median across every bracket, driven by a small number of very wealthy households in each age group.
Accumulation peaks at 60–69, then gently reverses
Both median and average net worth peak in the 60–69 cohort, right at the traditional retirement threshold, then decline modestly through the 70s. That inflection point is the visible result of decades of compounding finally giving way to withdrawal — the same mechanics explored in the Snowball Effect breakdown of how early, consistent investing multiplies over 30–40 years.
Why this matters for your RatRace Score
Net worth is the fuel tank; passive income is what actually gets burned to cover your expenses. A household sitting at the 60s-bracket median of $385K has a very different RatRace Score depending on whether that net worth sits in a checking account or in income-producing assets. Tracking both your net worth and your passive income — not just one or the other — is how you see whether your accumulation is actually being converted into freedom.
Curious exactly where your own net worth ranks? Try the Net Worth Percentile Calculator for an instant US and world percentile.
Track your own net worth alongside your RatRace Score.
Create a free account →Home · Learn · All Charts · Why Track? · Terms · Privacy