
Income benchmarks
US Household Income by Age
Source: U.S. Census Bureau, Current Population Survey (CPS) Annual Benchmarks — 2024 data
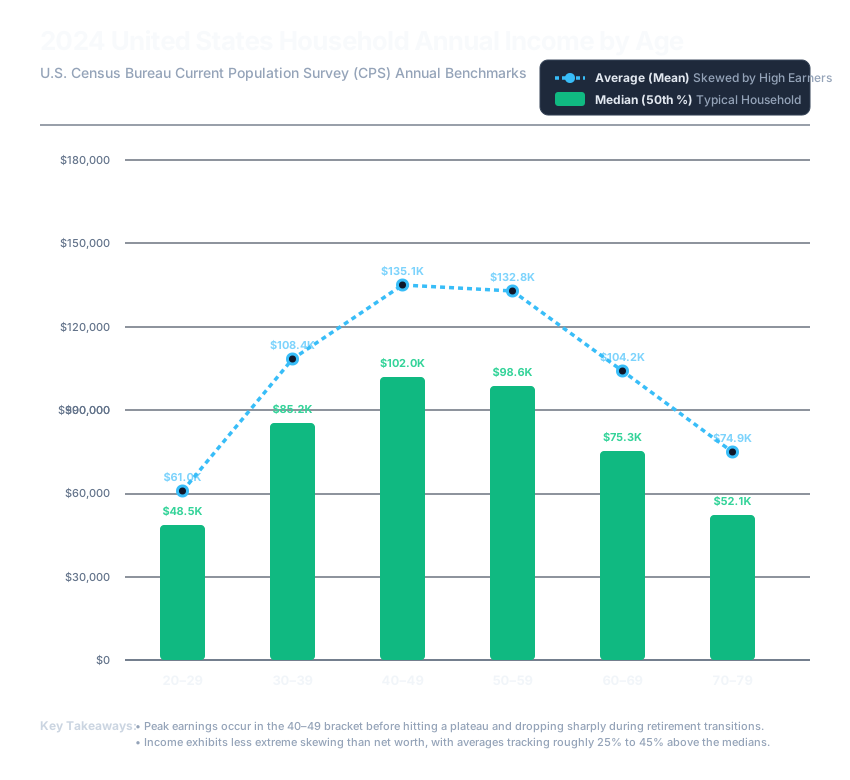
US household income follows a predictable arc: it climbs through the working years, peaks in mid-career, and declines after retirement. In 2024 CPS benchmarks, median income rises from $48,500 for households in their 20s to a peak of $102,000 in the 40–49 bracket, before falling to $52,100 by the 70s.
The 40s are peak earning years — and peak lifestyle-inflation risk
Both the median ($102.0K) and the average ($135.1K) household income peak in the 40–49 age bracket, then plateau through the 50s ($98.6K median / $132.8K average) before dropping sharply in the 60s and 70s as households transition into retirement. That decade of peak income is also the decade where lifestyle inflation is most dangerous — expenses tend to rise in lockstep with a growing paycheck, which keeps the RatRace Score denominator growing right alongside the numerator it's supposed to be outpacing.
Average vs. median: a moderate, not extreme, skew
Across every age bracket, the average income runs 25–45% above the median — high earners pull the mean up, but not nearly as dramatically as they do with net worth (see US Net Worth by Age, where the gap reaches 4–15x). Income is a flow; net worth is an accumulated stock, and stocks compound skew far more than flows do.
Why this matters for your RatRace Score
If your household income roughly tracks these benchmarks, the years between 30 and 50 are when you have the most raw income to convert into passive income — before the plateau, and long before the post-60s decline. The RatRace Score rewards households that redirect peak-earning-year income into assets that keep paying after the paycheck stops, rather than letting expenses absorb every raise.
Curious exactly where your own income ranks? Try the Income Percentile Calculator for an instant US and world percentile.
See how your income and expenses stack up — track your own RatRace Score.
Create a free account →Home · Learn · All Charts · Why Track? · Terms · Privacy