
Wealth thresholds
US Household Net Worth Elite Thresholds
Source: Minimum Entry Wealth Benchmarks Matched to a Strict Linear Scale — 2025 data
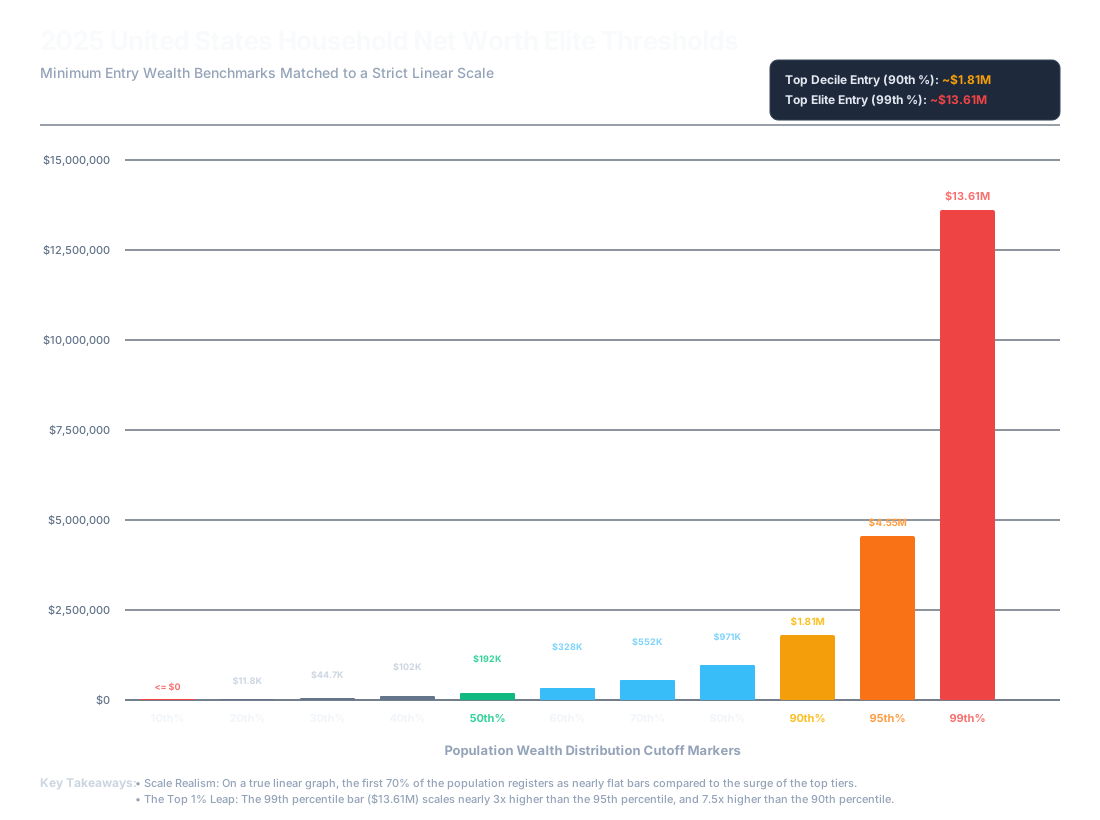
Plotted on a strict linear dollar scale, US household wealth thresholds reveal just how compressed the bottom 70% of the population really is. The median (50th percentile) household needs only $192,000 in net worth to clear the halfway mark — but reaching the top decile requires ~$1.81M, and the top 1% entry point is ~$13.61M.
The bottom 70% is nearly invisible on a linear scale
Entry thresholds climb slowly at first: $0 at the 10th percentile, $11.8K at the 20th, $44.7K at the 30th, $102K at the 40th. On a chart scaled to $15 million, all four of those bars round down to barely-visible slivers. It isn't until the 80th percentile ($971K) and 90th percentile ($1.81M) that the bars become visually meaningful — and the 99th percentile bar towers over everything else on the page.
The top 1% leap
The jump from the 90th to the 99th percentile is the single largest step in the entire distribution. At ~$13.61M, the top-1% threshold scales roughly 7.5x higher than the 90th-percentile entry point of $1.81M, and about 3x higher than the 95th-percentile threshold of $4.55M. Wealth doesn't taper off gradually at the top — it accelerates.
Why this matters for your RatRace Score
These thresholds are useful benchmarks, but the RatRace Score deliberately ignores where you sit on a national wealth ladder. A household with modest net worth but passive income that fully covers its (modest) expenses has a higher score — and more actual freedom — than a household with a much larger net worth still tied up in illiquid or non-income-producing assets. Use these numbers for context, not as the goal itself.
Want your exact percentile instead of the nearest decile? Try the Net Worth Percentile Calculator.
Net worth is context. Your RatRace Score is the number that actually predicts your freedom date.
Create a free account →Home · Learn · All Charts · Why Track? · Terms · Privacy